
Why this metric exists
Amazon search has always worked the same way for sellers: a shopper types keywords, Amazon returns a ranked page, and visibility is a function of position. Every tool in the seller ecosystem — rank trackers, keyword research, listing scores — was built for that world.
That world now has a second surface. Alexa for Shopping (formerly Rufus), Amazon's AI shopping assistant, answers product questions conversationally: "Which of these is best for a senior dog with itchy skin?" "Is this safe to use alongside other supplements?" "Which one is easiest to clean?" Instead of a page of results, the shopper gets an answer — and the answer names products.
This creates a question that rank cannot answer: when the AI compares you to your competitors on a real purchase question, how often does it pick you?
That is what Recommendation Share measures: the percentage of realistic purchase questions for which an AI shopping assistant recommends a given product over its named competitors. Unlike organic rank, which measures where a product appears, Recommendation Share measures whether the product is actually chosen when a question is asked.
This report is the first cross-category measurement of that metric, documented in full at the link above. It also builds on how Amazon's AI decides which product to recommend — the mechanics behind every number in this report.
Methodology
150 products across 30 niches in 6 categories were selected, snapshotted, and run through a frozen, multi-pass recommendation simulation — the same panel of questions asked of every listing in a niche, so the comparison is fair.
Product selection
On July 13, 2026, we captured the organic search results for the primary purchase query of 30 niches across 6 categories: Pet Supplements, Human Supplements, Skincare, Baby, Kitchen & Small Appliances, and Fitness & Recovery (5 niches each). For each niche, we selected the top 5 organic products — sponsored placements excluded, and same-parent variations excluded so that no product competes against itself. Listing content was snapshotted at selection time.
Question panels
For each niche, a frozen, versioned panel of 25 realistic purchase questions was generated, modeled on the intent dimensions described in Amazon's published research on shopping AI (COSMO, SIGMOD 2024; the Shopping Preference Network, WSDM 2025). Questions cover fit ("best for X"), usage, safety, comparison, value, and trust. Panels are frozen per niche: every product in a niche faces exactly the same questions.
Simulated judging
Each question was posed to a recommendation simulation that compares the five listings as evidence — titles, bullets, descriptions, and structured attributes, exactly as published. To eliminate bias, products are anonymized and their presentation order is randomized on every pass. Each question runs through three independent passes (2,250 judgments in total). Every choice must be grounded in specific, citable listing content; when no product provides evidence for a question, the pass returns no winner rather than guessing.
Metrics
A product's First-Rec Share is the share of conclusive judgments in which it was the first recommendation. Question-level outcomes are classified into verdicts: won (the reference product wins), copy gap (it loses despite having comparable content — a rewrite problem), product gap (the winner's product genuinely differs), fortress (a competitor's content is structurally dominant on that question), and white space (no product answers).
Limitations — read this before quoting the numbers
- This is a calibrated simulation, not a readout of Amazon's live systems. It is grounded in Amazon's published research and in listing content as shoppers and AI systems see it, but Amazon does not publish its production weighting, and no third-party tool measures the live algorithm. Results are directional and comparative — designed to reveal relative competitive standing within a niche, not absolute truth.
- Recommendation Share is a Keoxs metric, introduced in 2026. It is not an official Amazon metric.
- The study covers 5 products per niche (the organic top of each results page). Products below the fold, sponsored placements, and catalog long tails are out of scope.
- All measurements reflect listing content as of mid-July 2026. Listings change; so will these numbers — which is precisely why the metric is tracked over time.
Nothing in this report guarantees rankings, recommendations, or sales outcomes. It measures content as evidence, on a fixed date, with a documented method.
Rank does not predict recommendation
Across the 30 niches measured, a product's organic rank had almost no relationship to how often the AI recommended it — the average share by rank is flat from position 1 through position 5.
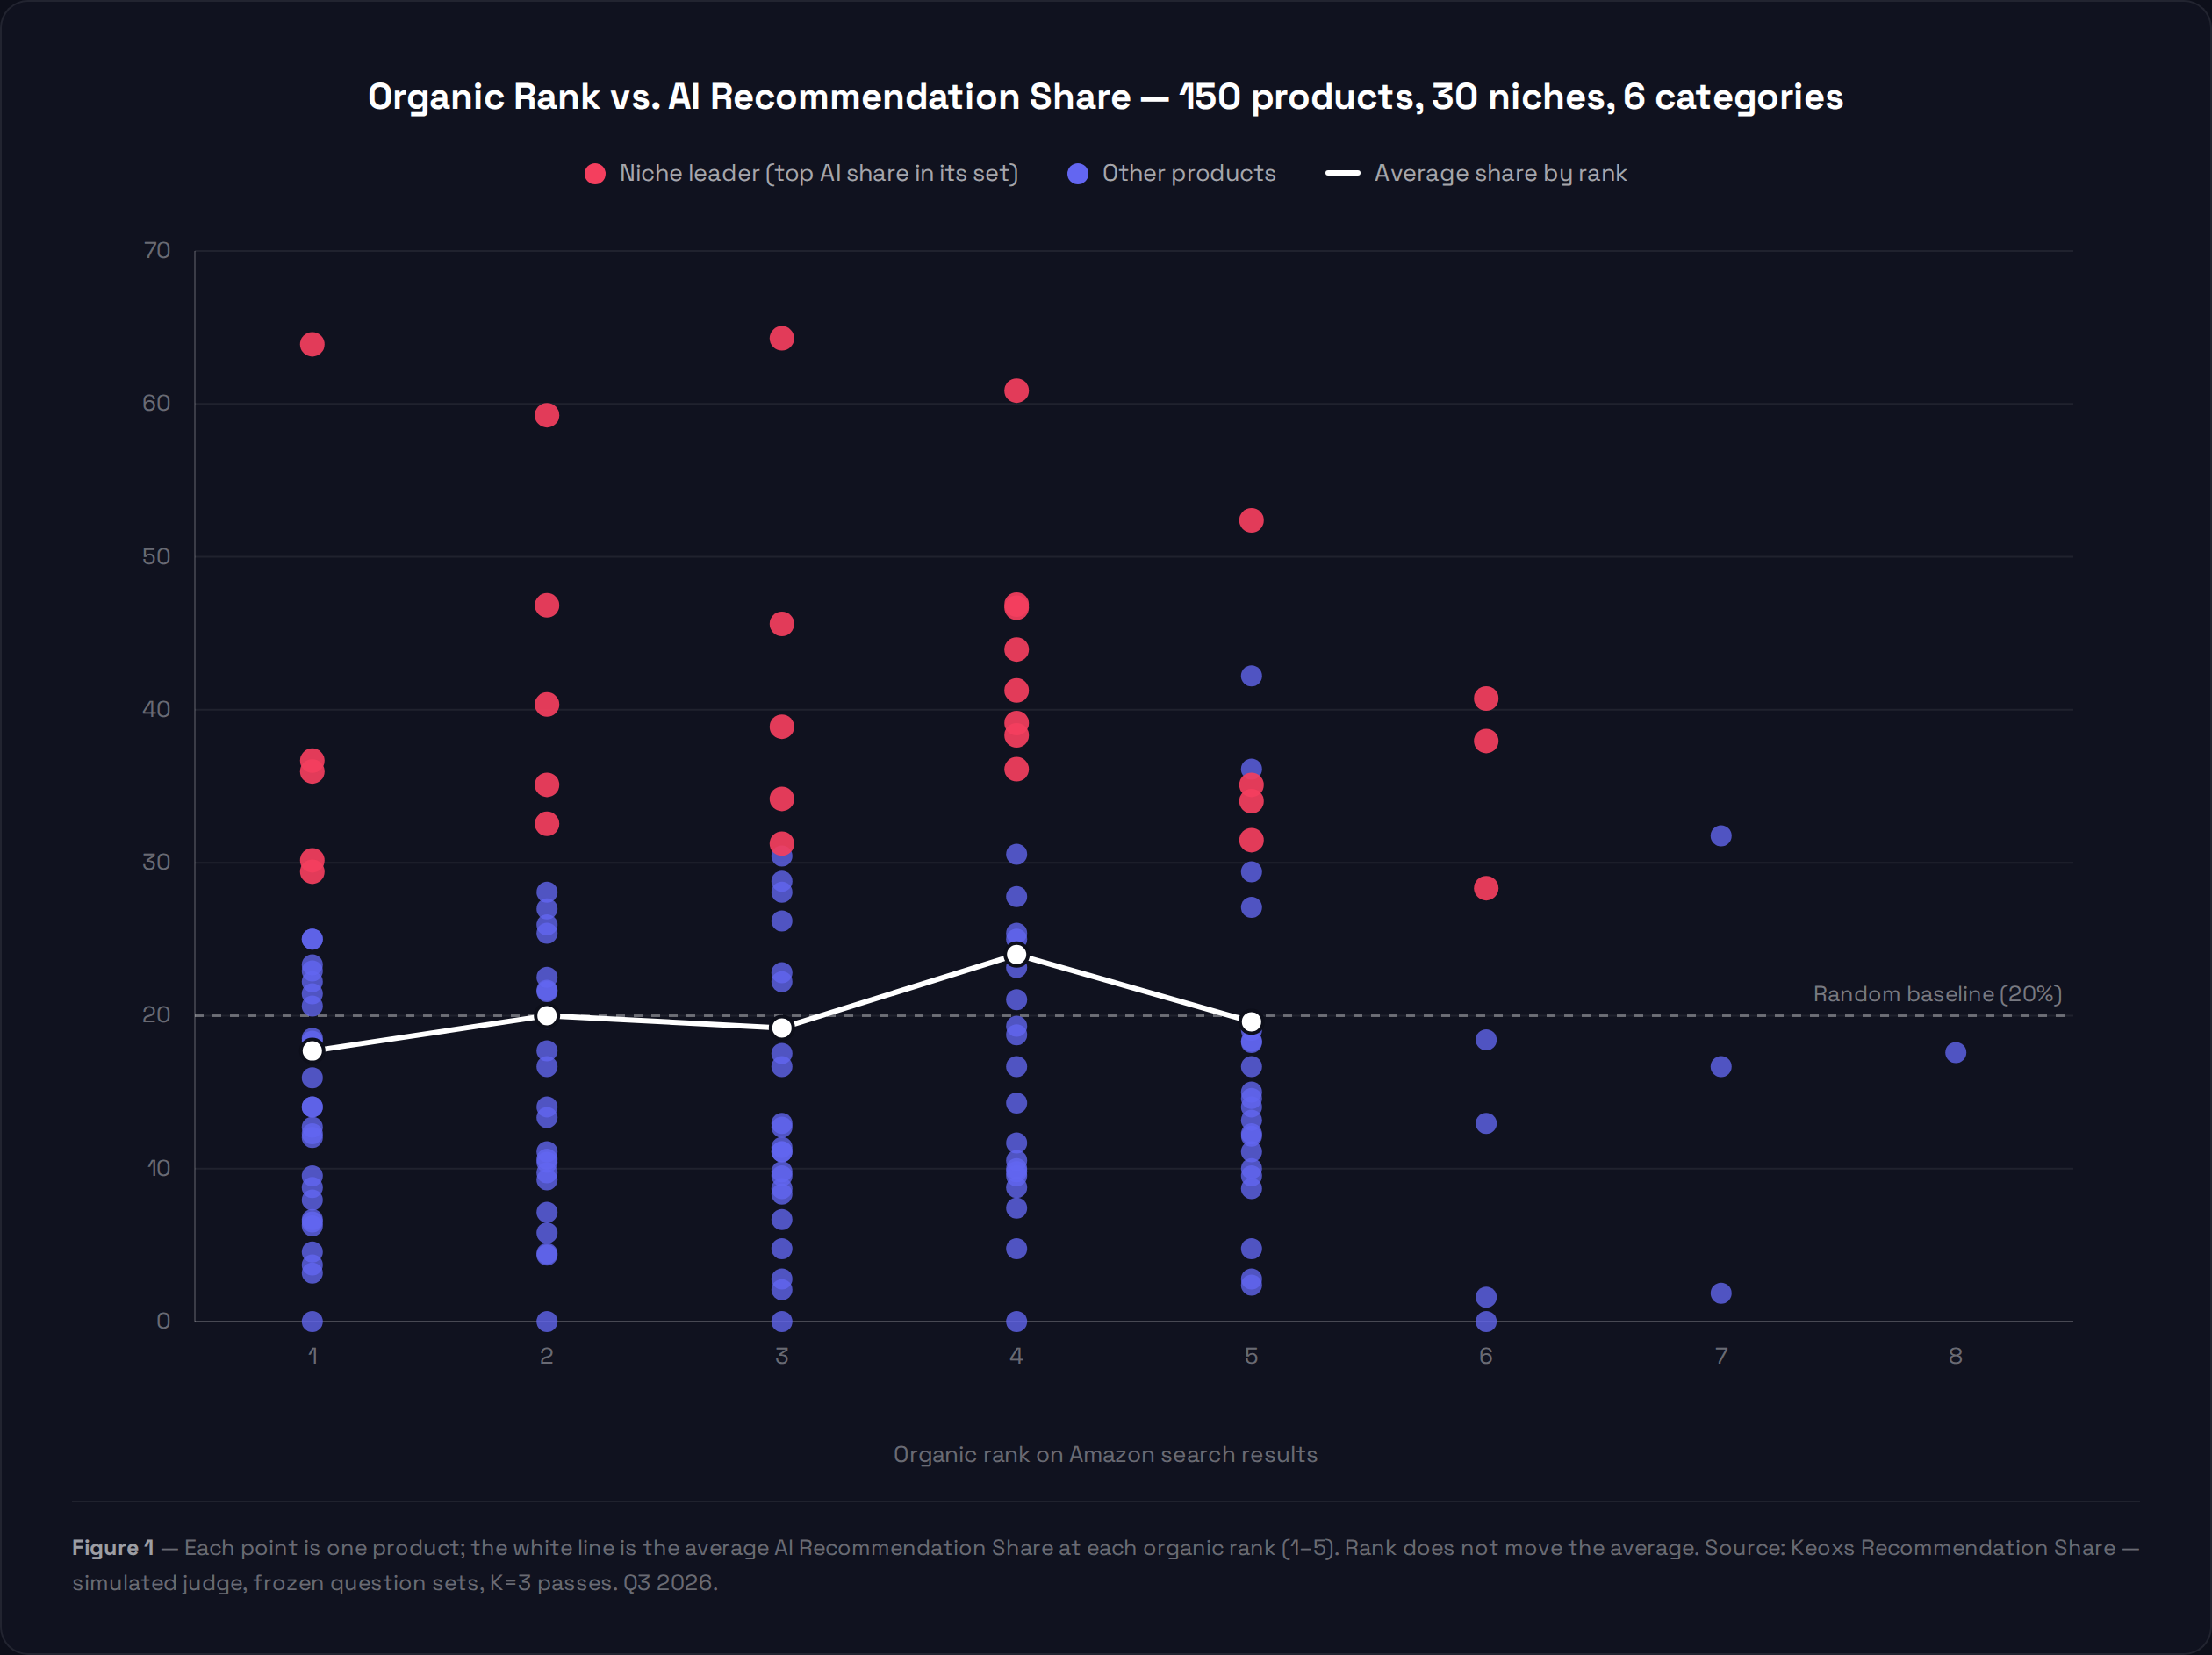
| Organic rank | Avg. AI Recommendation Share |
|---|---|
| #1 | 17.7% |
| #2 | 20.0% |
| #3 | 19.2% |
| #4 | 24.0% |
| #5 | 19.6% |
Read that last line again. With five products in each comparison, a product picked at random would win 20% of the time. Rank-one products came in below that baseline. Products ranked fourth — the ones "losing" the search battle — outperformed the products ranked first.
The curve is flat because the two outcomes are produced by two different machines. Organic rank reflects Amazon's search and sales systems: keywords, conversion history, velocity, reviews at scale. An AI recommendation is a content-versus-content comparison against a specific question: does this listing answer what the shopper asked, with specific, verifiable claims? A listing engineered to rank — keyword-dense, superlative-heavy — can be nearly mute when read as evidence.
One pet-supplement niche in the study illustrates the pattern: the rank-one product, a household brand name with over 100,000 reviews, captured 22% of first recommendations. The rank-two product — a smaller brand whose bullets answer purchase questions directly (year-round vs. seasonal use, gut-health mechanism, palatability, dosage duration) — captured 41%, nearly double. Same shelf, same questions, opposite outcomes.
In 12 niches out of 30 (40%), the product capturing the most AI recommendations is ranked #4 or #5 in organic results — not first, not second, sometimes not even in the top 3.
What this means: rank remains what drives most traffic today, and nothing here suggests abandoning it. But rank now buys you a seat at a table where a different game is being played — and a meaningful share of the seats at the top of that table are being beaten by products the ranking says shouldn't win.
No niche is locked (yet)
If AI recommendations simply mirrored brand dominance, the biggest brand would sweep its niche and the story would end there. That is not what the data shows.
- The average niche leader captures 41% of first recommendations.
- The most concentrated niche in the study peaks at 64% — and in one of the three most concentrated niches, the leader is ranked #4 organically.
- The least concentrated niches sit at 28-30%, with recommendations spread across four or five products.
In other words: even where one product clearly out-answers its competitors, more than a third of AI recommendations remain contested. There is no niche in this study where the game is over.
There is also no niche where dominance was bought by rank or review count alone. The leaders in our data are the products whose content covers the most questions with the most specific evidence — and several of them are mid-ranked products that few rank-trackers would flag as threats.
What this means: the current window is an anomaly. Almost no seller is optimizing for AI recommendation yet; the leaders are winning largely by accident of writing better bullets. The first brands in each niche to optimize deliberately will take share from incumbents who don't know this game exists.
The white space: 22% of questions have no answer
For every question in every niche, we classified the outcome. Across 750 questions (754 question-level verdicts):
| Outcome | Share | What it means |
|---|---|---|
| Reference product wins | 14% | Its content answers the question best |
| Copy gap | 7% | It loses despite having comparable content — fixable by rewriting |
| Product gap | 22% | The winner's product genuinely differs — a roadmap signal, not a copy problem |
| Fortress | 34% | A competitor's content is structurally dominant on this question |
| White space | 22% | No product answers the question at all |
Percentages rounded to the nearest whole number; individually round down enough that the column sums to 99%, not exactly 100%.
The headline is the last row. On more than one purchase question in five, the AI found no product in the niche — not one of five listings — providing any evidence to answer.
And these are not exotic questions. The white space clusters around the exact themes anxious buyers ask before purchasing:
- Safety and contraindications — "Is this safe for dogs with open sores or post-surgical recovery?"
- Interactions — "Can this be taken alongside other daily supplements or preventatives?"
- Allergens and formulation — "Is this grain-free, gluten-free, free from common allergens?"
- Third-party certifications — "Does this carry NASC, GMP, or USDA Organic certification?"
- Time-to-results — "How soon should I expect to see improvement?"
These are the questions that decide considered purchases. Entire niches are silent on them — likely because they never generated keyword volume, so keyword-driven copywriting never covered them. An AI assistant doesn't need keyword volume to ask them. Shoppers ask them every day.
A white-space question has a specific property: it is won by default by the first product that answers it. No competitor to displace, no fortress to siege. If your product genuinely is grain-free, is third-party certified, can be safely combined — saying so, specifically and verifiably, converts a silent question into a won question.
One honest caveat our own data imposes: pure copy gaps — where a product already has the content but it doesn't surface — account for only 7% of questions. The popular framing "most of your losses are just bad copywriting" is not supported here. The real opportunity is split between the white space (22% of all questions, open to everyone) and the fortress battles (34%, where a competitor built content coverage you haven't). Both are content problems. Neither is fixed by keyword optimization.
A category footnote: the pattern's intensity varies. In Human Supplements — the most competitive category we measured — the rank-one product won just 5% of its questions, the lowest of any category, while fortress outcomes peaked. The categories where ranking "lies" the most are the ones where content competition is already fiercest.
What sellers should do with this
Five implications, in order of leverage:
- Measure before you optimize. You cannot see your Recommendation Share in Seller Central, and your rank won't tell you. Until you've measured which questions you win and lose against your actual competitors, you're optimizing blind on this surface.
- Claim the white space first. It's the cheapest share available: questions nobody answers, won by whoever answers first. Audit your niche's silent questions — safety, interactions, certifications, time-to-results — and cover every one where your product has a true, verifiable answer.
- Write evidence, not keywords. "Premium quality your pet will love" is invisible to a system comparing claims. "Vet-formulated, 300mg quercetin per chew, NASC-certified" is evidence. Every bullet should let a skeptical reader — human or AI — verify something.
- Treat product gaps as roadmap intelligence. When you lose a question because the competitor's product genuinely differs, no rewrite fixes it. Recurring product-gap losses across questions are your customers telling you what to build or bundle next.
- Track it over time. AI models shift, competitors rewrite, questions evolve. A measurement is a snapshot; the durable asset is the trend line — knowing when you gain ground and when a competitor moves.
Rank still pays the bills today. But the answer surface is growing, it obeys different rules, and — as of this measurement — almost nobody is playing it on purpose. That is what an open window looks like.
About this report
This report was produced by Keoxs, the Recommendation Share platform for Amazon sellers. All measurements were run with Keoxs's simulated judging pipeline on public listing content, using frozen question panels, multi-pass judging, and per-judgment content citations. Raw per-niche data is retained and the methodology is documented at keoxs.com/guides/what-is-recommendation-share.
Vol. 2 of this series (Q4 2026) will re-measure the same 30 niches — same frozen questions, same method — and report what changed in 90 days.
The comparison in this article is grounded in Amazon's published research (COSMO, SIGMOD 2024; SPN Shopping Agent, WSDM 2025), adapted by Keoxs — not a description of Amazon's live, confirmed ranking logic. The measurements above come from Keoxs's own Recommendation Share reports run against real, named products in the category studied.